Sleep Analysis: The Basic Way
Note: This particular post contains a snippet of code that enables lightbox functionality for images. Click on any image to enlarge it, and then click anywhere outside the image to close it.
There is a reason I spend a third of my day sleeping: I love sleeping. I can sleep anytime, anywhere, for any duration (not because I have some kind of sleep disorder). I have also been tracking my sleep for a decent bit now. I started using the app Sleep Cycle to track my sleep data on February 5, 2020. Then, at some point, I got an Apple Watch and started using it to track my sleep data as well. Even if you don't use the Sleep Cycle app to start a sleep session, it can still use the data generated by the Apple Watch to provide an analysis of your sleep quality.
This part is a naive analysis where I am not taking into account workouts, weather patterns, or any other factors that might influence sleep quality except for step count. This is just a simple approach that I will improve upon by connecting it to other data sources if I ever feel like it.
This part is a naive analysis where I am not taking into account workouts, weather patterns, or any other factors that might influence sleep quality except for step count. This is just a simple approach that I will improve upon by connecting it to other data sources if I ever feel like it.
The overarching motivation is to just generate some pretty graphs.
Dataset
I exported the dataset from Sleep Cycle as a CSV file (separated by a semicolon, so it is technically not a CSV file). Here is a sample of the data:
Start;End;Sleep Quality;Regularity;Awake (seconds);Dream (seconds);Light (seconds);Deep (seconds);Mood;Heart rate (bpm);Steps;Alarm mode;Air Pressure (Pa);City;Movements per hour;Time in bed (seconds);Time asleep (seconds);Time before sleep (seconds);Window start;Window stop;Snore time (seconds);Weather temperature (°C);Weather type;Notes;Body temperature deviation (degrees Celsius);Ambient Noise (dB);Respiratory rate (breaths per minute);Coughs (per hour)
2020-02-05 11:57:22;2020-02-05 19:04:28;65%;0%;4869.0;0.0;20757.5;0.0;;0;262;Normal;99.0;;31.4;25626.5;20757.5;1195.9;2020-02-05 19:00:00;2020-02-05 19:30:00;3090.0;0.0;No weather;;;;;
2020-02-06 10:30:49;2020-02-06 17:15:27;61%;0%;3965.4;0.0;20312.6;0.0;;0;181;Normal;99.1;;55.2;24278.0;20312.6;1618.5;2020-02-06 17:00:00;2020-02-06 17:30:00;3018.0;0.0;No weather;;;;;
2020-02-07 10:10:57;2020-02-07 16:19:07;67%;89%;3607.9;0.0;18481.5;0.0;;0;1416;Normal;99.3;;35.3;22089.5;18481.5;2871.6;2020-02-07 16:15:00;2020-02-07 16:45:00;2635.0;0.0;No weather;;;;;
2020-02-08 12:40:13;2020-02-08 18:15:45;65%;76%;2751.3;0.0;17380.2;0.0;;0;76;Normal;99.4;;23.2;20131.5;17380.2;1543.4;2020-02-08 18:10:00;2020-02-08 18:40:00;64.0;0.0;No weather;;;;;
2020-02-09 10:59:55;2020-02-09 16:11:00;54%;74%;3546.3;0.0;15118.4;0.0;;0;73;Normal;99.4;;35.9;18664.7;15118.4;1431.0;2020-02-09 16:00:00;2020-02-09 16:30:00;364.0;0.0;No weather;;;;;
2020-02-10 10:52:59;2020-02-10 18:02:03;74%;72%;2831.8;0.0;22911.7;0.0;;0;1762;Normal;99.3;;35.1;25743.5;22911.7;1373.0;2020-02-10 18:00:00;2020-02-10 18:30:00;367.0;0.0;No weather;;;;;
2020-02-11 10:38:59;2020-02-11 19:06:47;71%;80%;4265.5;0.0;26202.5;0.0;OK;0;4905;Normal;99.4;New Delhi;57.2;30468.1;26202.5;4265.5;2020-02-11 19:00:00;2020-02-11 19:30:00;0.0;0.0;No weather;Stressful day:Worked out;;;;
2020-02-12 02:30:16;2020-02-12 03:00:48;7%;46%;36.6;0.0;1795.1;0.0;OK;0;16;Normal;99.1;New Delhi;0.0;1831.7;1795.1;36.6;2020-02-12 03:00:00;2020-02-12 03:00:00;0.0;0.0;No weather;Nap;;;;
2020-02-12 10:54:08;2020-02-12 19:10:04;76%;90%;6645.6;0.0;23110.7;0.0;Good;0;43;Normal;99.1;New Delhi;51.5;29756.3;23110.7;4165.9;2020-02-12 19:15:00;2020-02-12 19:30:00;87.0;0.0;No weather;At Home:Nap:Studied;;;;
I was never really good at using the tagging functionality to add tags to my sleep sessions, so I am not going to care about them. I am also only going to be using the last twelve months of data for my analysis.
import pandas as pd

fp = 'sleepdata.csv'
df = pd.read_csv(fp, sep=";")

df["Start"] = pd.to_datetime(df['Start'], errors='coerce')

cutoff_date = df["Start"].max() - timedelta(days=365)
df_filtered = df[df["Start"] >= cutoff_date]
df_filtered is what I used for the analysis. I will try to include relevant code snippets where needed, but this isn't really a programming tutorial.
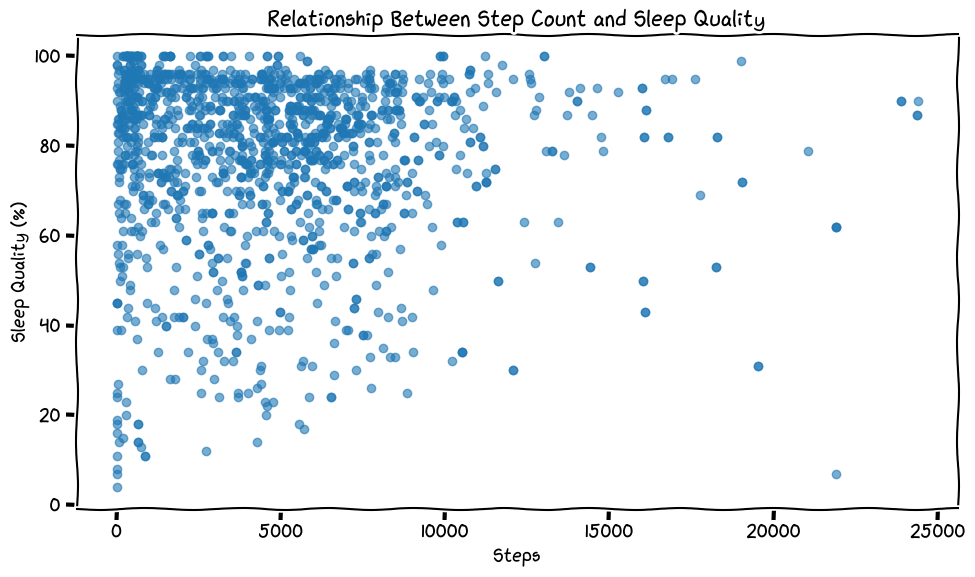
Sleep Quality vs Step Count
I will try to include relevant code snippets where needed, but this isn't really a programming tutorial.
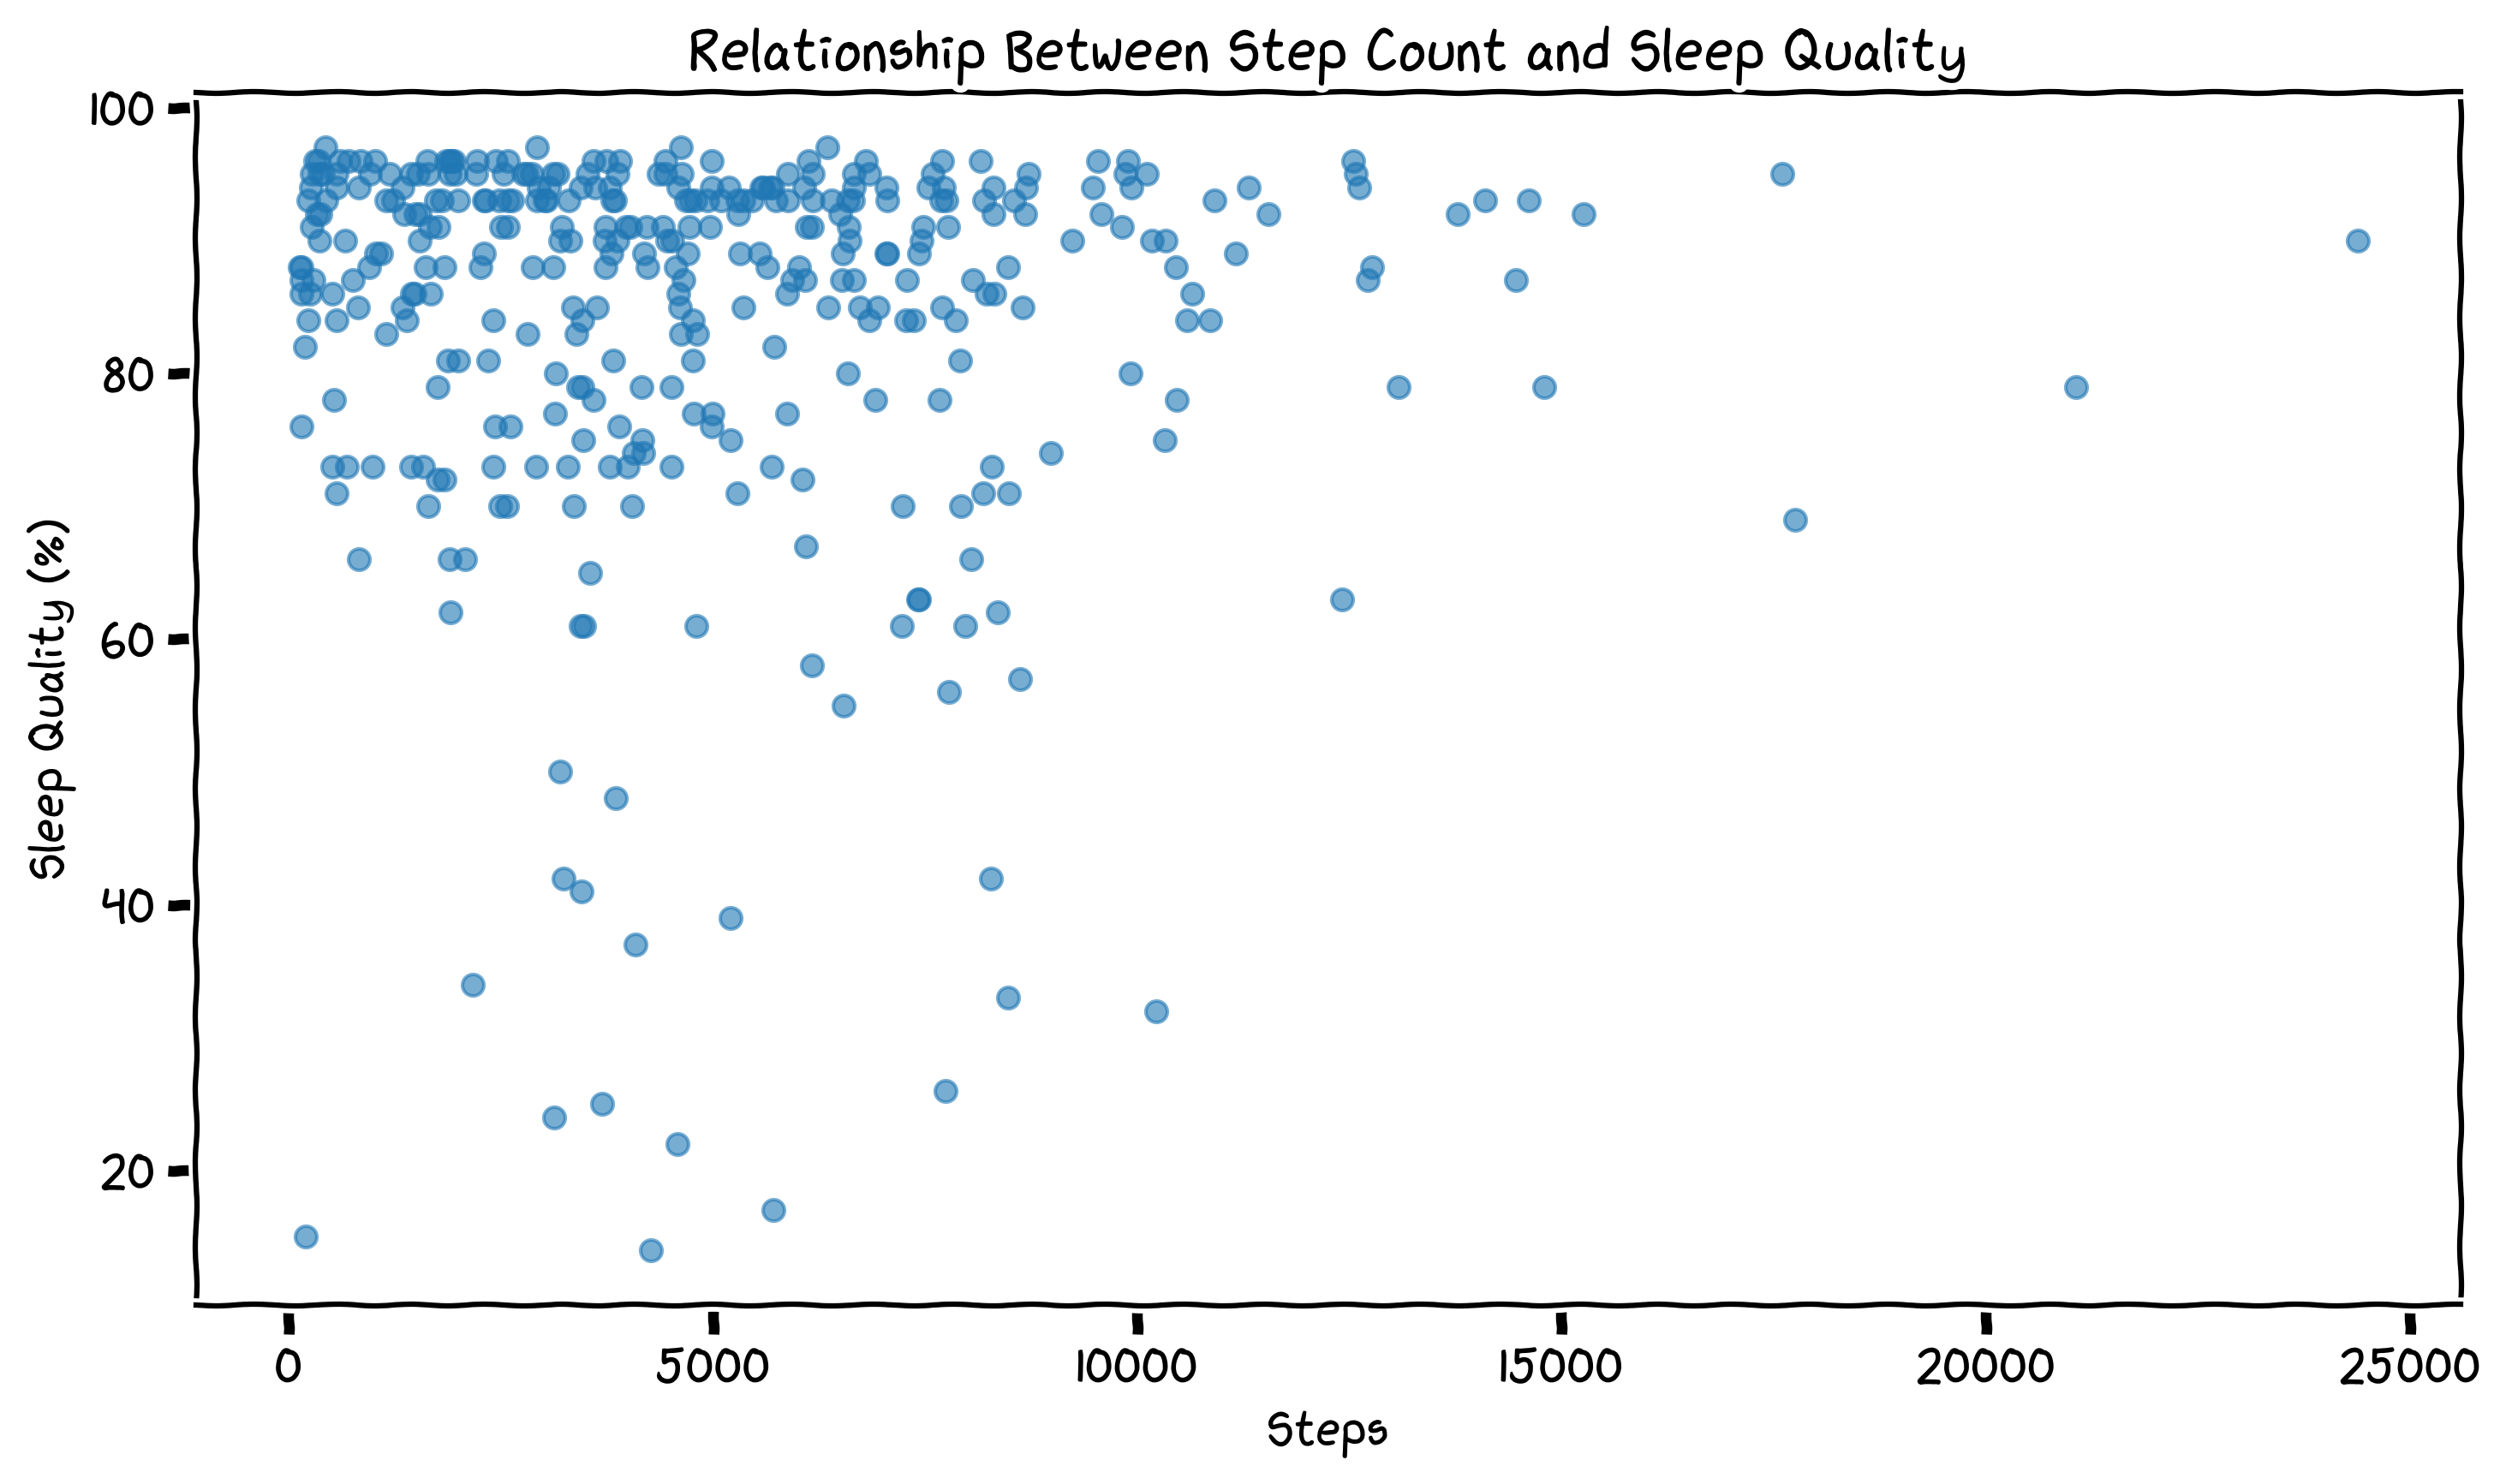
I actually went back and ran this on the full dataset and the results were similar.
Days of the Week
The next thing I was curious about was how the day of the week affected my sleep quality and other metrics. I excluded naps (defined by a sleep duration of less than 3 hours) and broke down the days of the week into hour bins (sample size >= 3).
df_filtered['DayOfWeek'] = df_filtered['Start'].dt.day_name()
df_filtered['Hour'] = df_filtered['Start'].dt.hour

day_order = ['Monday', 'Tuesday', 'Wednesday', 'Thursday', 'Friday', 'Saturday', 'Sunday']
df_filtered['Time asleep (seconds)'] = pd.to_numeric(df_filtered['Time asleep (seconds)'], errors='coerce')
df_no_naps = df_filtered[df_filtered['Time asleep (seconds)'] >= 10800]

mean_quality = df_no_naps.groupby(['DayOfWeek', 'Hour'])['Sleep Quality'].mean().unstack().reindex(day_order)
sample_size = df_no_naps.groupby(['DayOfWeek', 'Hour'])['Sleep Quality'].count().unstack().reindex(day_order)
avg_hours_slept = df_no_naps.groupby(['DayOfWeek', 'Hour'])['Time asleep (seconds)'].mean().unstack().reindex(day_order) / 3600

mean_quality_rounded = mean_quality.round(2).map(lambda x: f"{x:.1f}")
avg_hours_slept_rounded = avg_hours_slept.round(1)
sample_size_int = sample_size.fillna(0).astype(int)

annotations_combined = (
    mean_quality_rounded.astype(str) + "%\n" +
    avg_hours_slept_rounded.astype(str) + "h\n(" +
    sample_size_int.astype(str) + ")"
)

mask = sample_size >= 3
mean_quality_masked = mean_quality.where(mask, np.nan).round(2)
annotations_combined_masked = annotations_combined.where(mask, "")

mean_quality_masked = mean_quality_masked.astype(float)

non_empty_hours = mean_quality_masked.columns[mean_quality_masked.notna().any()]
mean_quality_masked = mean_quality_masked[non_empty_hours]
annotations_combined_masked = annotations_combined_masked[non_empty_hours]

with plt.xkcd():
  plt.figure(figsize=(14, 6))
  sns.heatmap(mean_quality_masked, cmap='YlGnBu', annot=annotations_combined_masked, fmt='', linewidths=0.5,
            annot_kws={"color": "black"})
  plt.title('Sleep Quality, Duration, and Sample Size by Day and Hour (Excl. Naps, Sample Size ≥ 3)')
  plt.xlabel('Hour of Day')
  plt.ylabel('Day of Week')
  plt.tight_layout()
  plt.show()
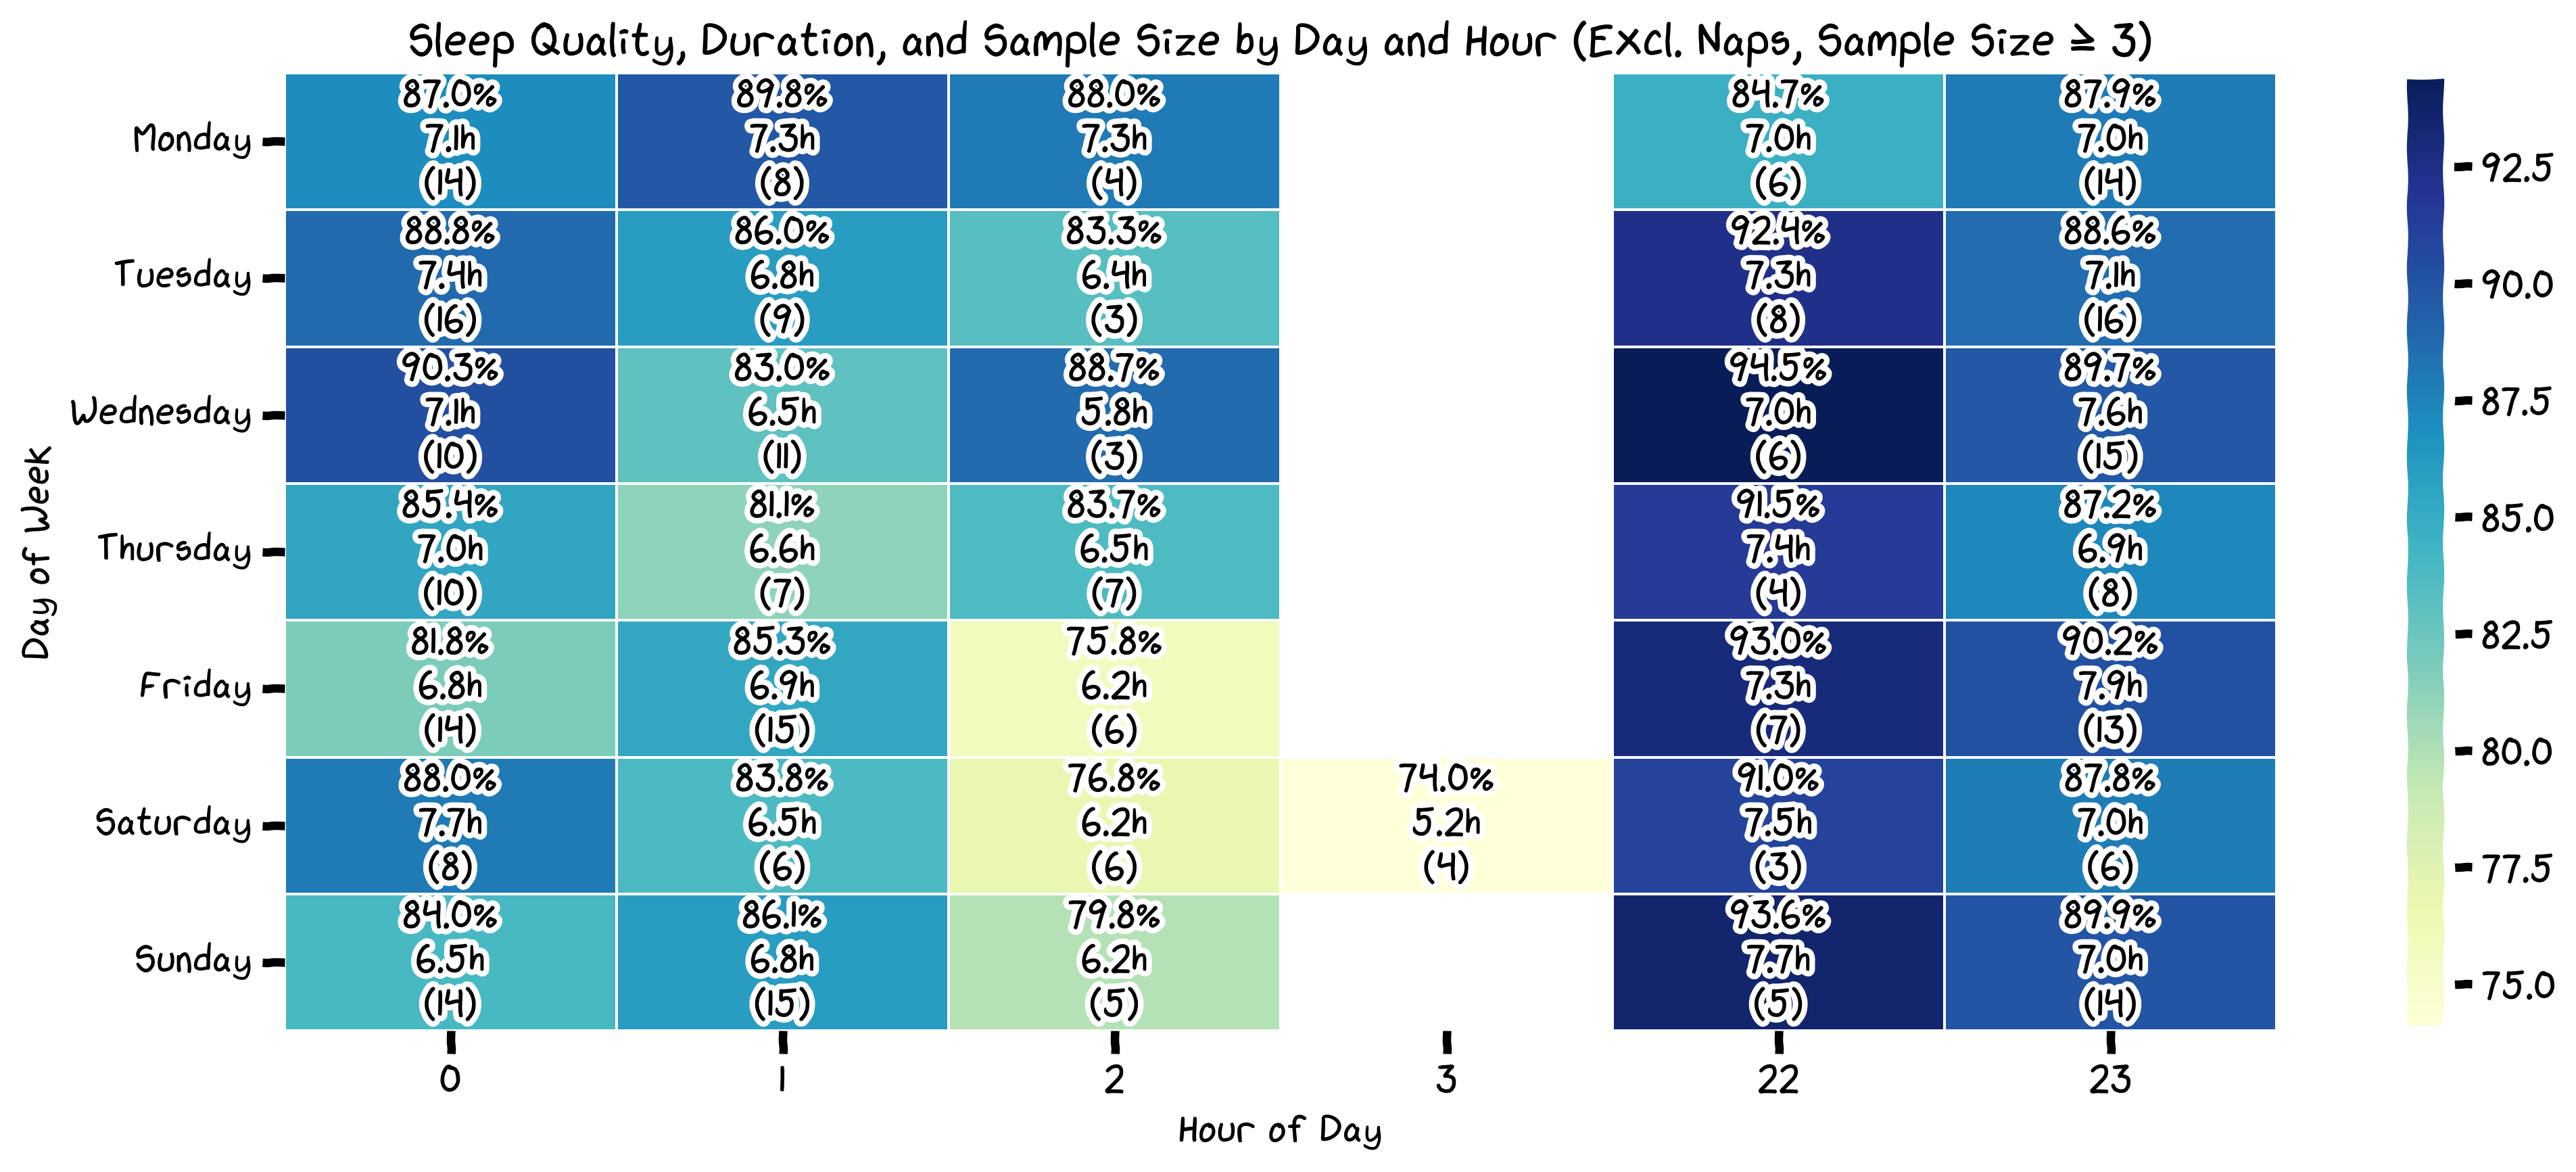
I go a bit more in-depth to figure out what time I should start going to bed later on.
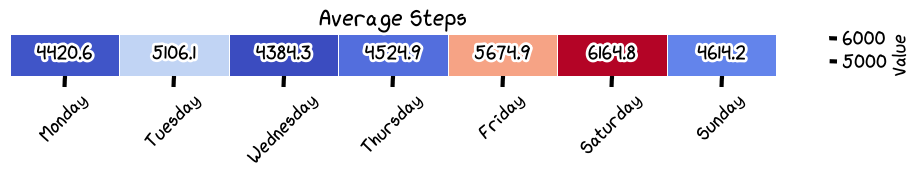
For the other metrics, I decided to generate a simple heatmap.
df_no_naps['StartDay'] = df_no_naps['Start'].dt.day_name()
df_no_naps['End'] = pd.to_datetime(df_no_naps['End'], errors='coerce')
df_no_naps['EndDay'] = df_no_naps['End'].dt.day_name()

metrics = {
    'Time in bed (seconds)': 'Average Time in Bed (hrs)',
    'Awake (seconds)': 'Average Awake Time (mins)',
    'Heart rate (bpm)': 'Average Heart Rate (bpm)',
    'Regularity': 'Average Sleep Regularity (%)',
    'Steps': 'Average Steps'
}


if df_no_naps['Regularity'].dtype == object:
    df_no_naps['Regularity'] = pd.to_numeric(df_no_naps['Regularity'].str.replace('%', ''), errors='coerce')

single_row_heatmaps = {}
for column, label in metrics.items():
    data = df_no_naps.copy()
    group = data.groupby('StartDay')[column].mean().reindex(day_order)
    if column == 'Time in bed (seconds)':
        group /= 3600  # hours
    elif column == 'Awake (seconds)':
        group /= 60  # minutes
    single_row_heatmaps[label] = group
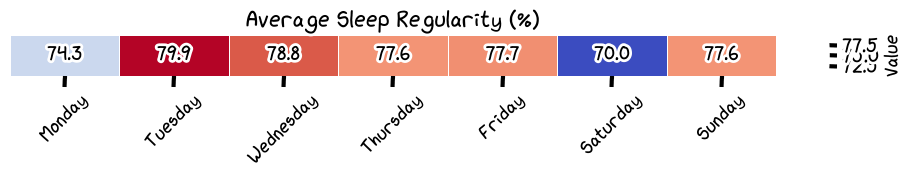
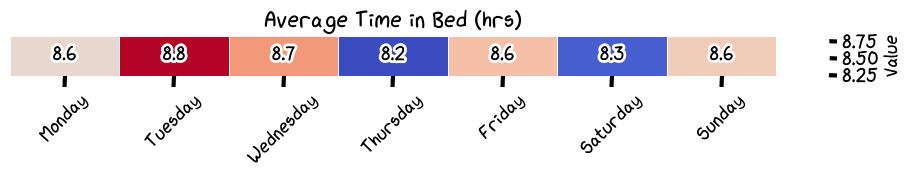
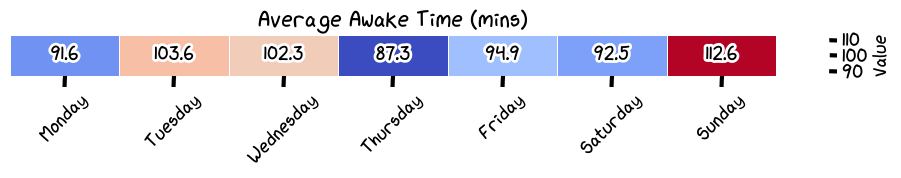
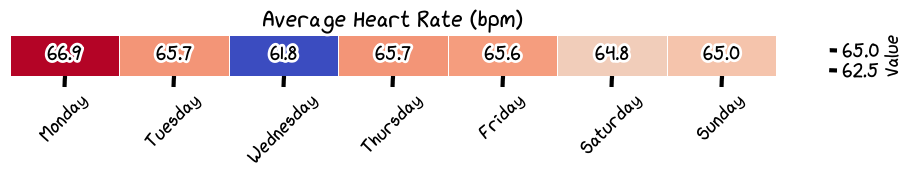
The last two plots don't really give much information. What is interesting is the fact that my awake time in bed is so long! I have never really felt that before, and I have always thought I fall asleep pretty quickly. This could either be incorrect data, or I need to start paying more attention. I also need to start going to bed at the same damn time—my regularity is so bad.
I also could not fix the colourbar while generating these with the xkcd theme :(
Correlation Matrix
No analysis is complete without having a correlation matrix.
correlation_data = df_no_naps[[
    'Sleep Quality', 'Time in bed (seconds)', 'Awake (seconds)',
    'Heart rate (bpm)', 'Regularity', 'Steps'
]].copy()

correlation_data['Time in bed (seconds)'] /= 3600
correlation_data['Awake (seconds)'] /= 60

correlation_matrix = correlation_data.corr()
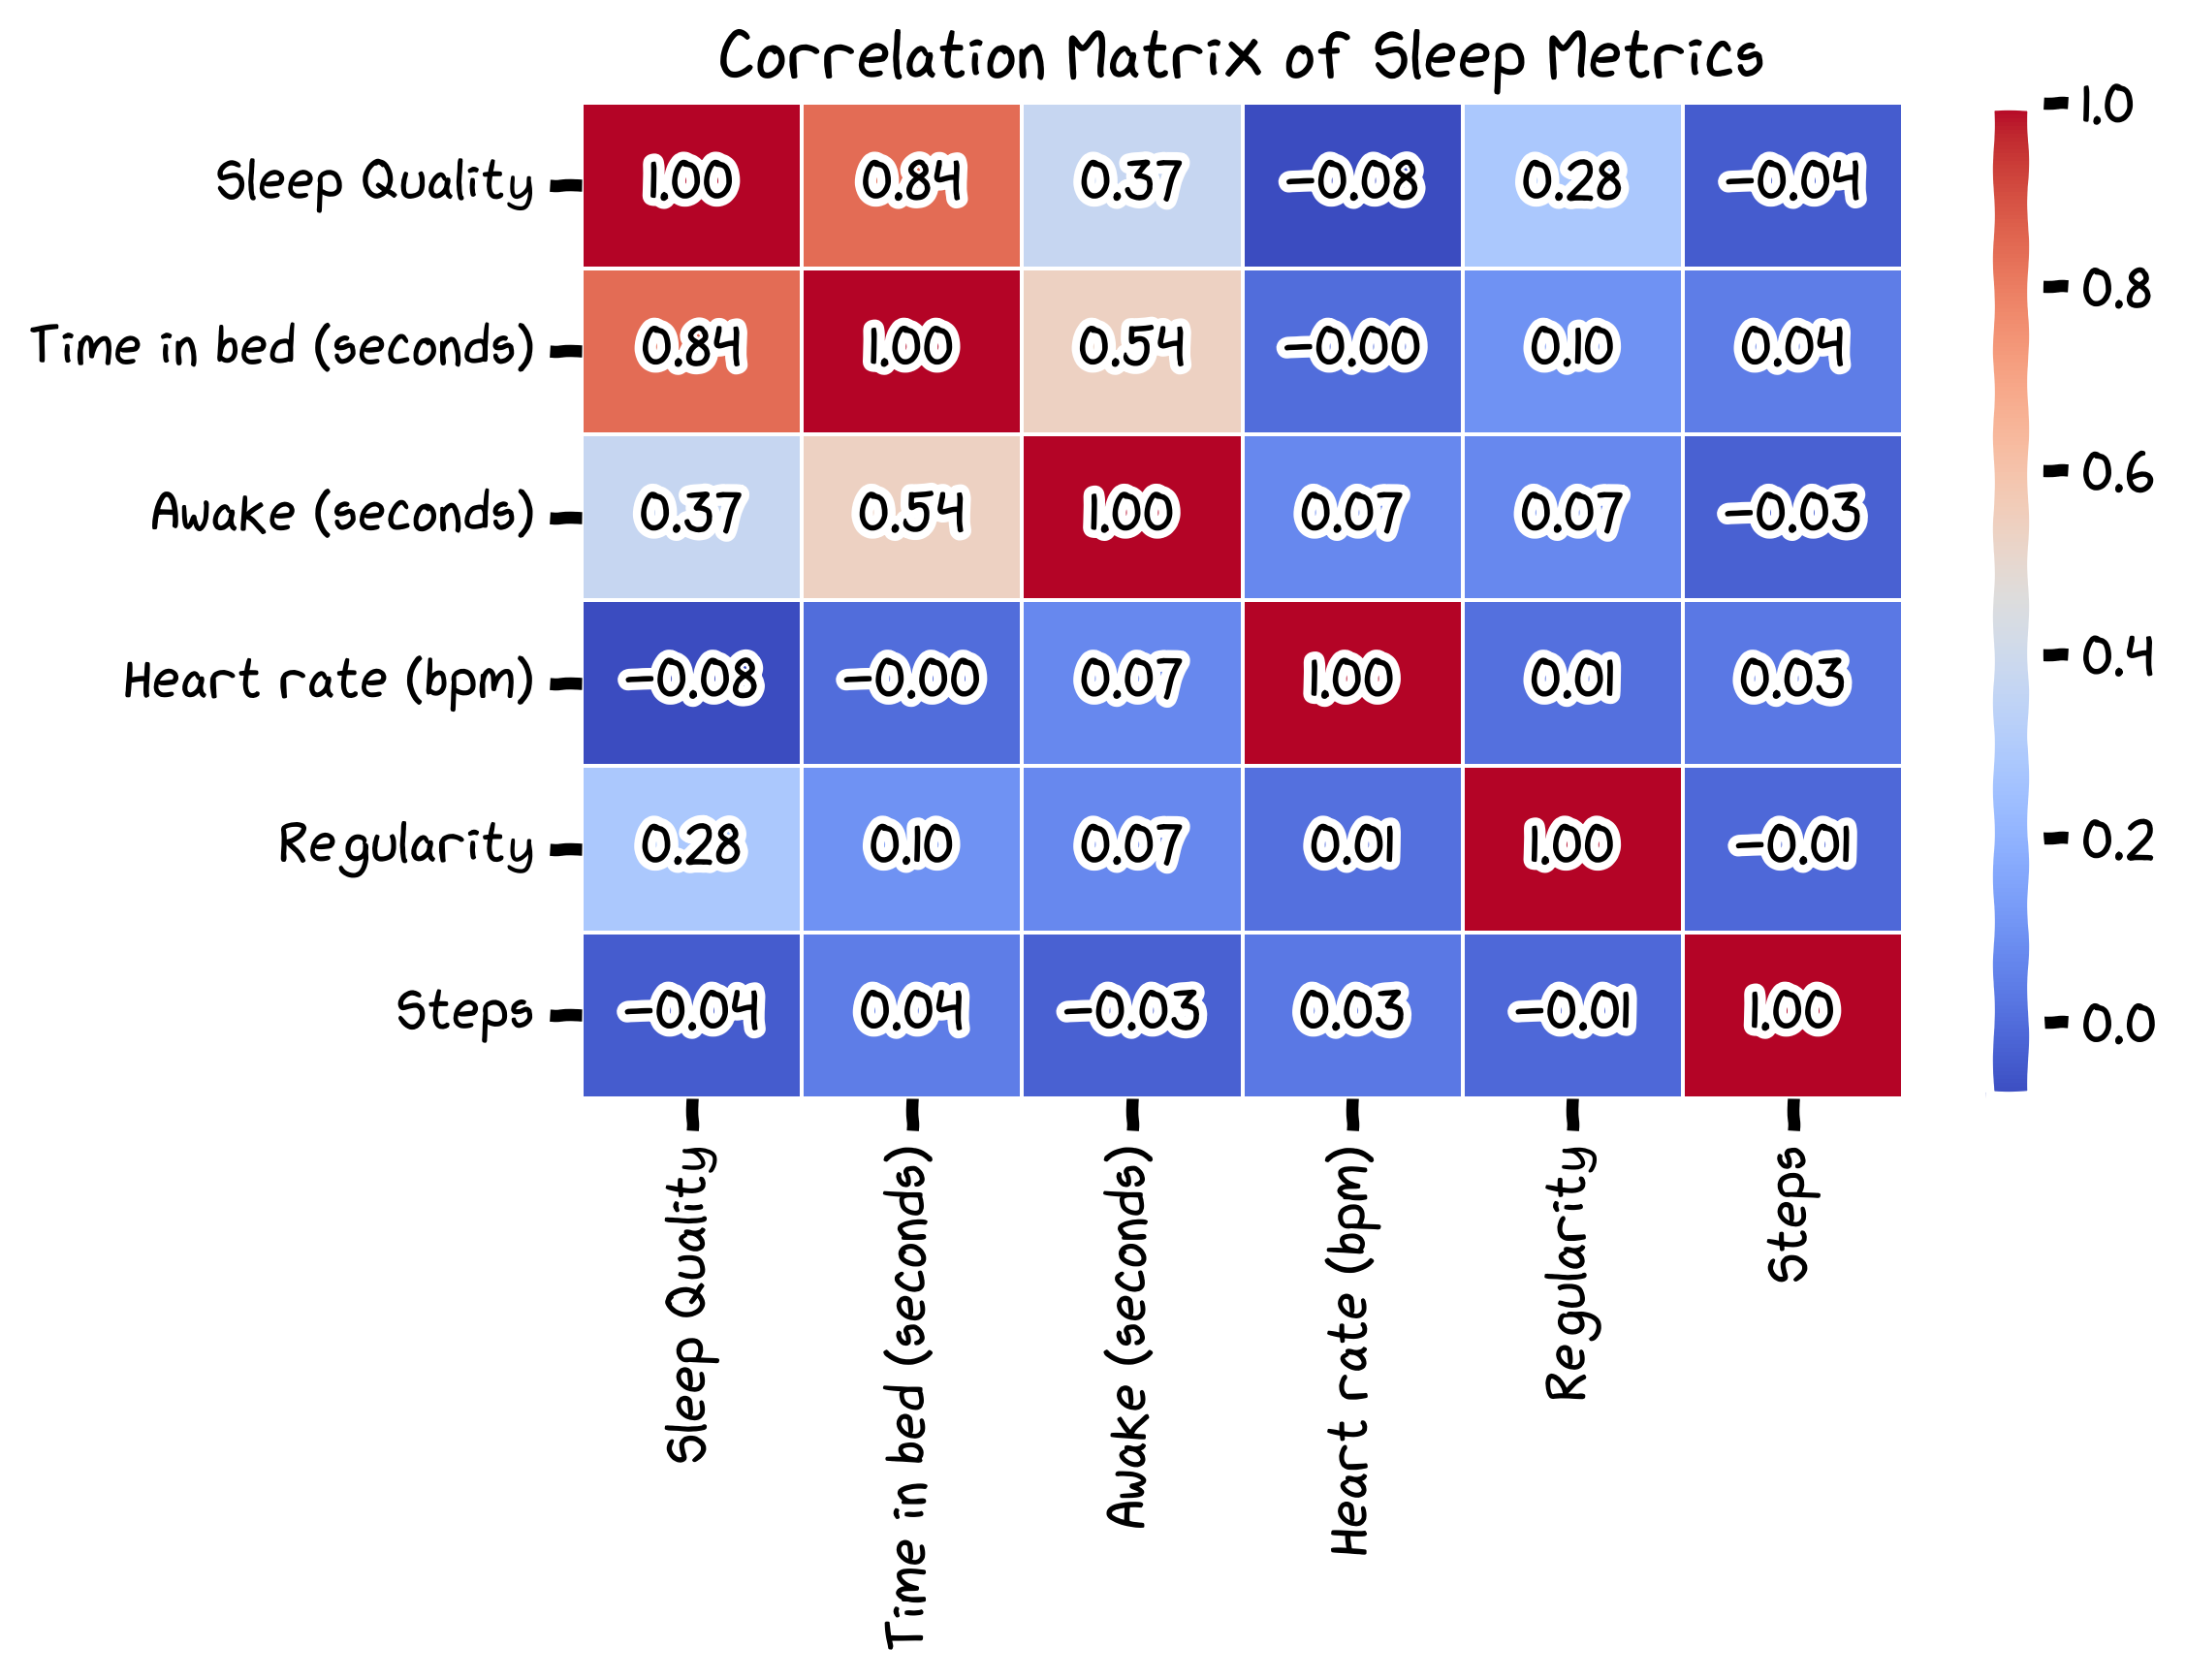
- This proves that there is basically little to no correlation between sleep quality and step count.
- The longer I spend in bed, the better my sleep quality is (go figure!).
- Time awake in bed is actually positively correlated with sleep quality.
Basically, a lot of the metrics in this dataset don't really affect my sleep quality.
Sleep Quality Distribution
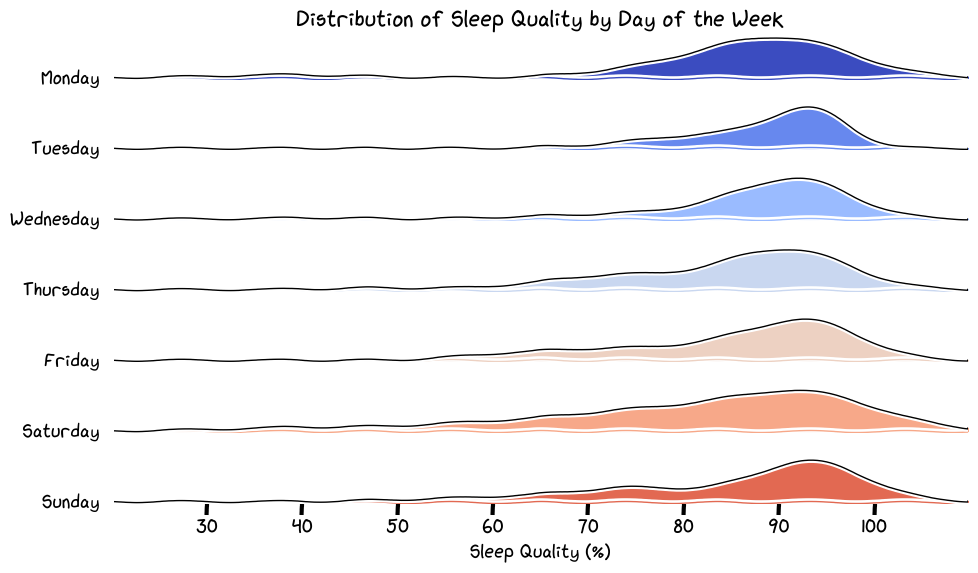
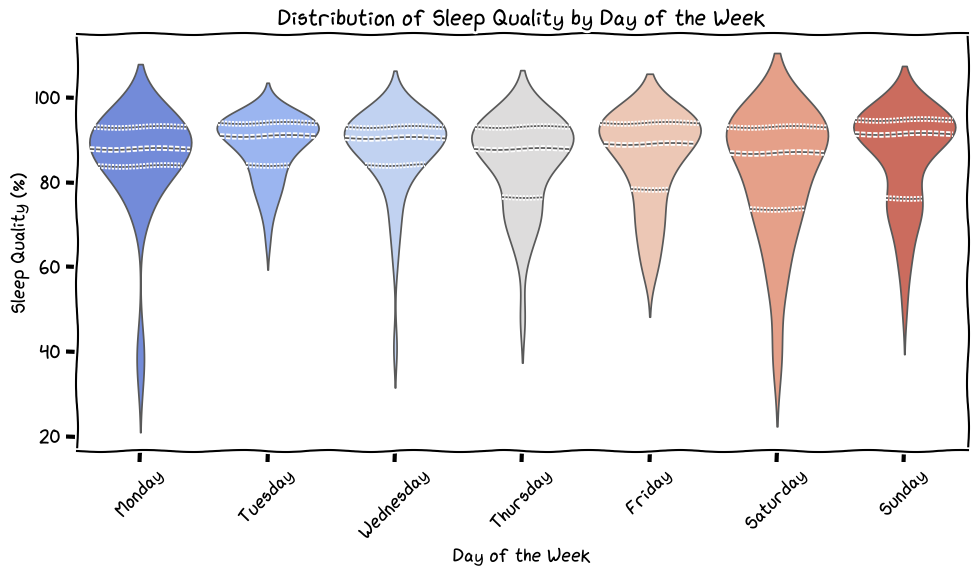
Looking at Monday and Wednesday, could the sleep quality be affected by the fact that I slept for fewer hours on these days because I was waking up earlier to ski? Maybe.
Thursday (karaoke night at Dark Horse) and then just going out with friends on Saturday explains the variability in sleep quality.
How much should I sleep?
df_bins = df_clean.copy()
df_bins['Time in Bed (min)'] = df_bins['Time asleep (seconds)'] / 60

bin_size = 30
min_bin = 300  # 5 hours
max_bin = 540  # 9 hours

def label_time_bin(minutes):
    if minutes < min_bin:
        return "<5h"
    elif minutes >= max_bin:
        return ">9h"
    else:
        start = int((minutes // bin_size) * bin_size)
        end = start + bin_size
        return f"{start//60}h{start%60:02d}–{end//60}h{end%60:02d}"

df_bins['Bin Raw'] = (df_bins['Time in Bed (min)'] // bin_size) * bin_size
df_bins['Time Bin Label'] = df_bins['Time in Bed (min)'].apply(label_time_bin)

bin_summary = df_bins.groupby('Time Bin Label')['Sleep Quality'].mean().reset_index()

custom_sort = lambda x: (
    -1 if x == "<5h" else
    9999 if x == ">9h" else
    int(x.split('h')[0]) * 60 + int(x.split('h')[1].split('–')[0])
)
bin_summary['SortKey'] = bin_summary['Time Bin Label'].apply(custom_sort)
bin_summary = bin_summary.sort_values('SortKey').drop(columns='SortKey')

sleep_quality_values = bin_summary['Sleep Quality'].astype(float).values.reshape(1, -1)
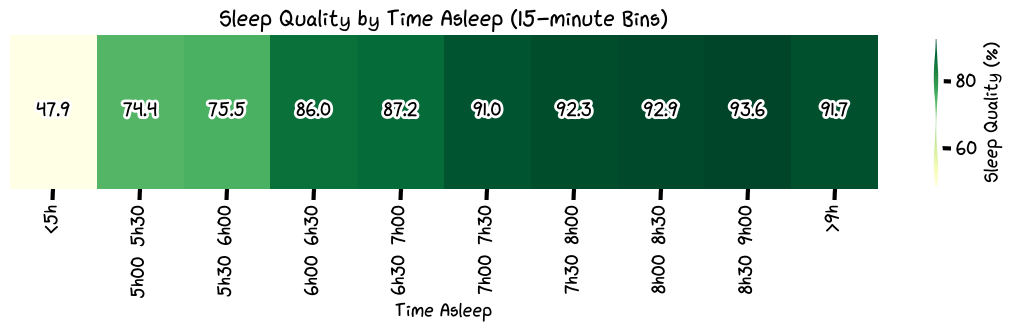
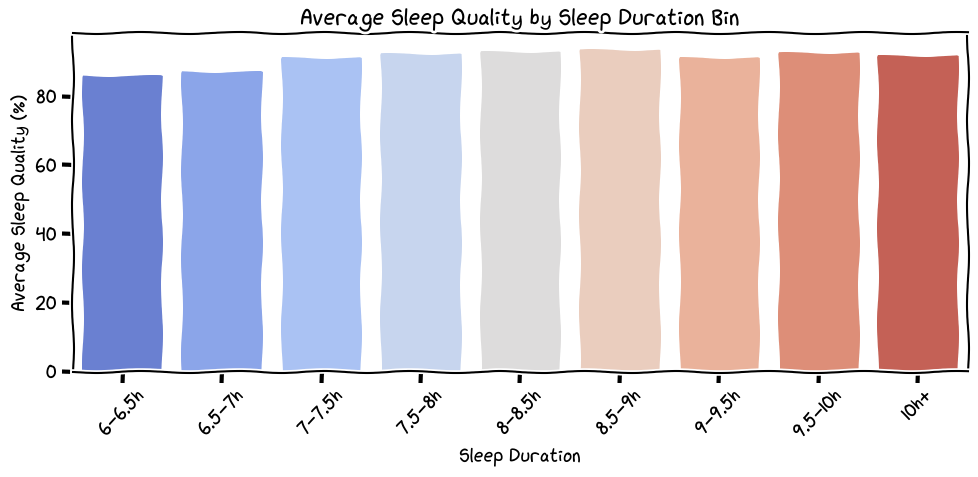
So, the day of the week doesn't really affect my sleep quality that much. The ridge and violin plots above did show the variability and distribution, but on average my sleep quality is decent. What the sleep quality by time asleep shows is that I need a minimum of 6.5 hours of sleep to feel good; otherwise my sleep quality is just tired. This means I can start getting away with 7 hours of sleep instead of the full 8 hours like I normally thought I needed. Although, in an ideal world, I would like to get 8.5 hours of sleep.
Sleep Quality Over Time
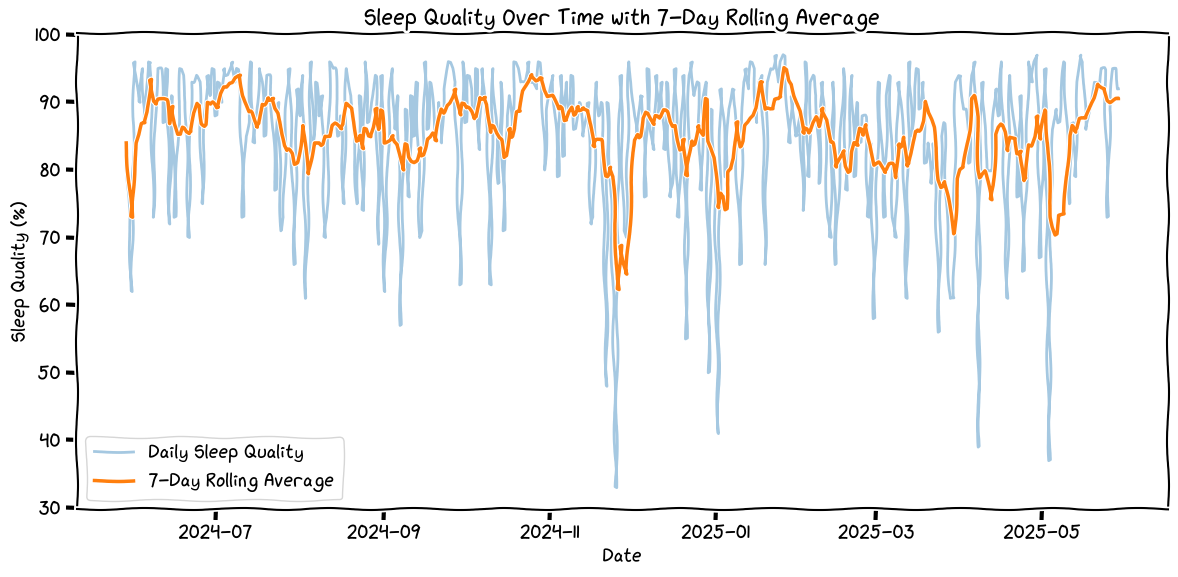
This kind of tracks. I know the reason for the massive dips, and they aren't really that glamorous.
df_clean = df_filtered.copy()
df_calendar = df_clean[['Start', 'Sleep Quality']].copy()
df_calendar['Start'] = pd.to_datetime(df_calendar['Start'])
df_calendar['Date'] = df_calendar['Start'].dt.date
df_calendar = df_calendar.groupby('Date')['Sleep Quality'].mean().reset_index()

date_range = pd.date_range(start=df_calendar['Date'].min(), end=df_calendar['Date'].max(), freq='D')
calendar_df = pd.DataFrame({'Date': date_range})
calendar_df['Sleep Quality'] = calendar_df['Date'].map(df_calendar.set_index('Date')['Sleep Quality'])

calendar_df['Week'] = calendar_df['Date'].apply(lambda d: d.isocalendar()[1])
calendar_df['Day'] = calendar_df['Date'].dt.weekday  # Monday = 0
calendar_df['Year'] = calendar_df['Date'].dt.year
calendar_df['Week of Year'] = (calendar_df['Date'] - pd.to_datetime(f"{calendar_df['Date'].min()}")).dt.days // 7
heatmap_data = calendar_df.pivot(index="Day", columns="Week of Year", values="Sleep Quality")
heatmap_data = heatmap_data.astype(float)
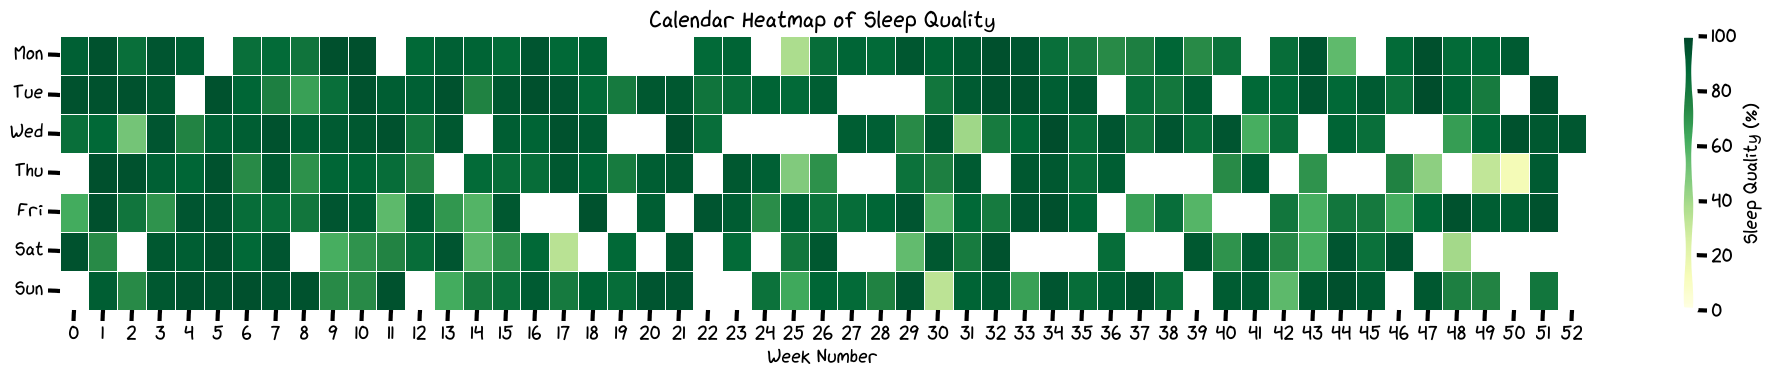
This is just a cool plot that shows my sleep quality as if it were a GitHub contribution calendar.
Conclusion
So, did I learn anything new? Kind of. I can get away with 7 hours of sleep, and it is probably okay for me to stay up until 1AM. What's next? If I am still interested, I will try to sync the sleep data with all the other data I have in the Apple Health app (workouts from Strava, other stats from my watch), along with stuff like air pressure in the location, phase of the moon, and weather conditions. Am I expecting much? Not really, but it's worth a try.