CU Boulder Grades Search
- CU Boulder Grades Search
In every student's journey, there comes a time when they need to take classes that complete their general education requirements. Or, sometimes you need to decide between two different professors teaching the same course, and Rate My Professor isn't helping you at all. The Data & Analytics group at CU Boulder provides grade distributions of all main campus courses. You can already see where I am going with this.
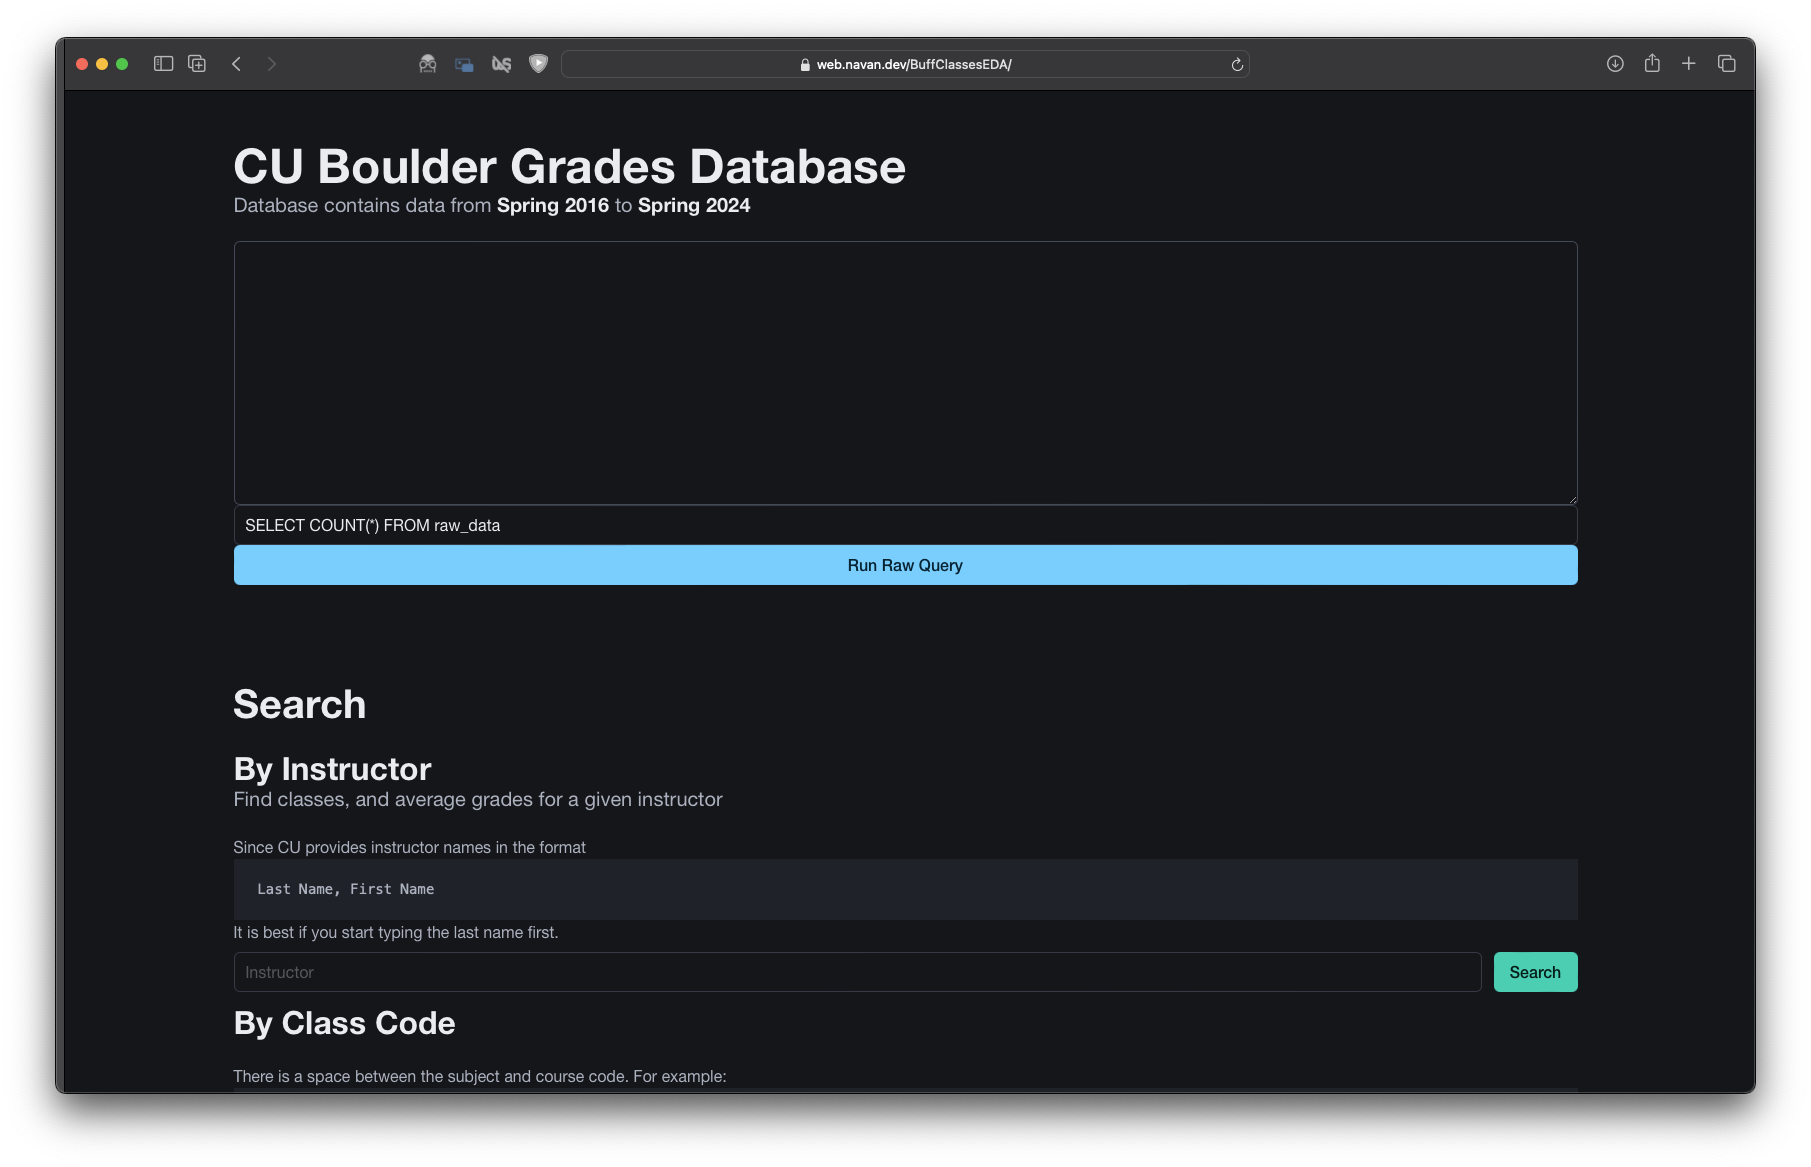
Live demo: https://web.navan.dev/BuffClassesEDA
Exploring and Exporting the Data
The data is provided as a spreadsheet and contains data of main campus courses with 10+ grades (including passes), from Fall 2006 to Spring 2024. This spreadsheet is updated after both fall and spring terms.
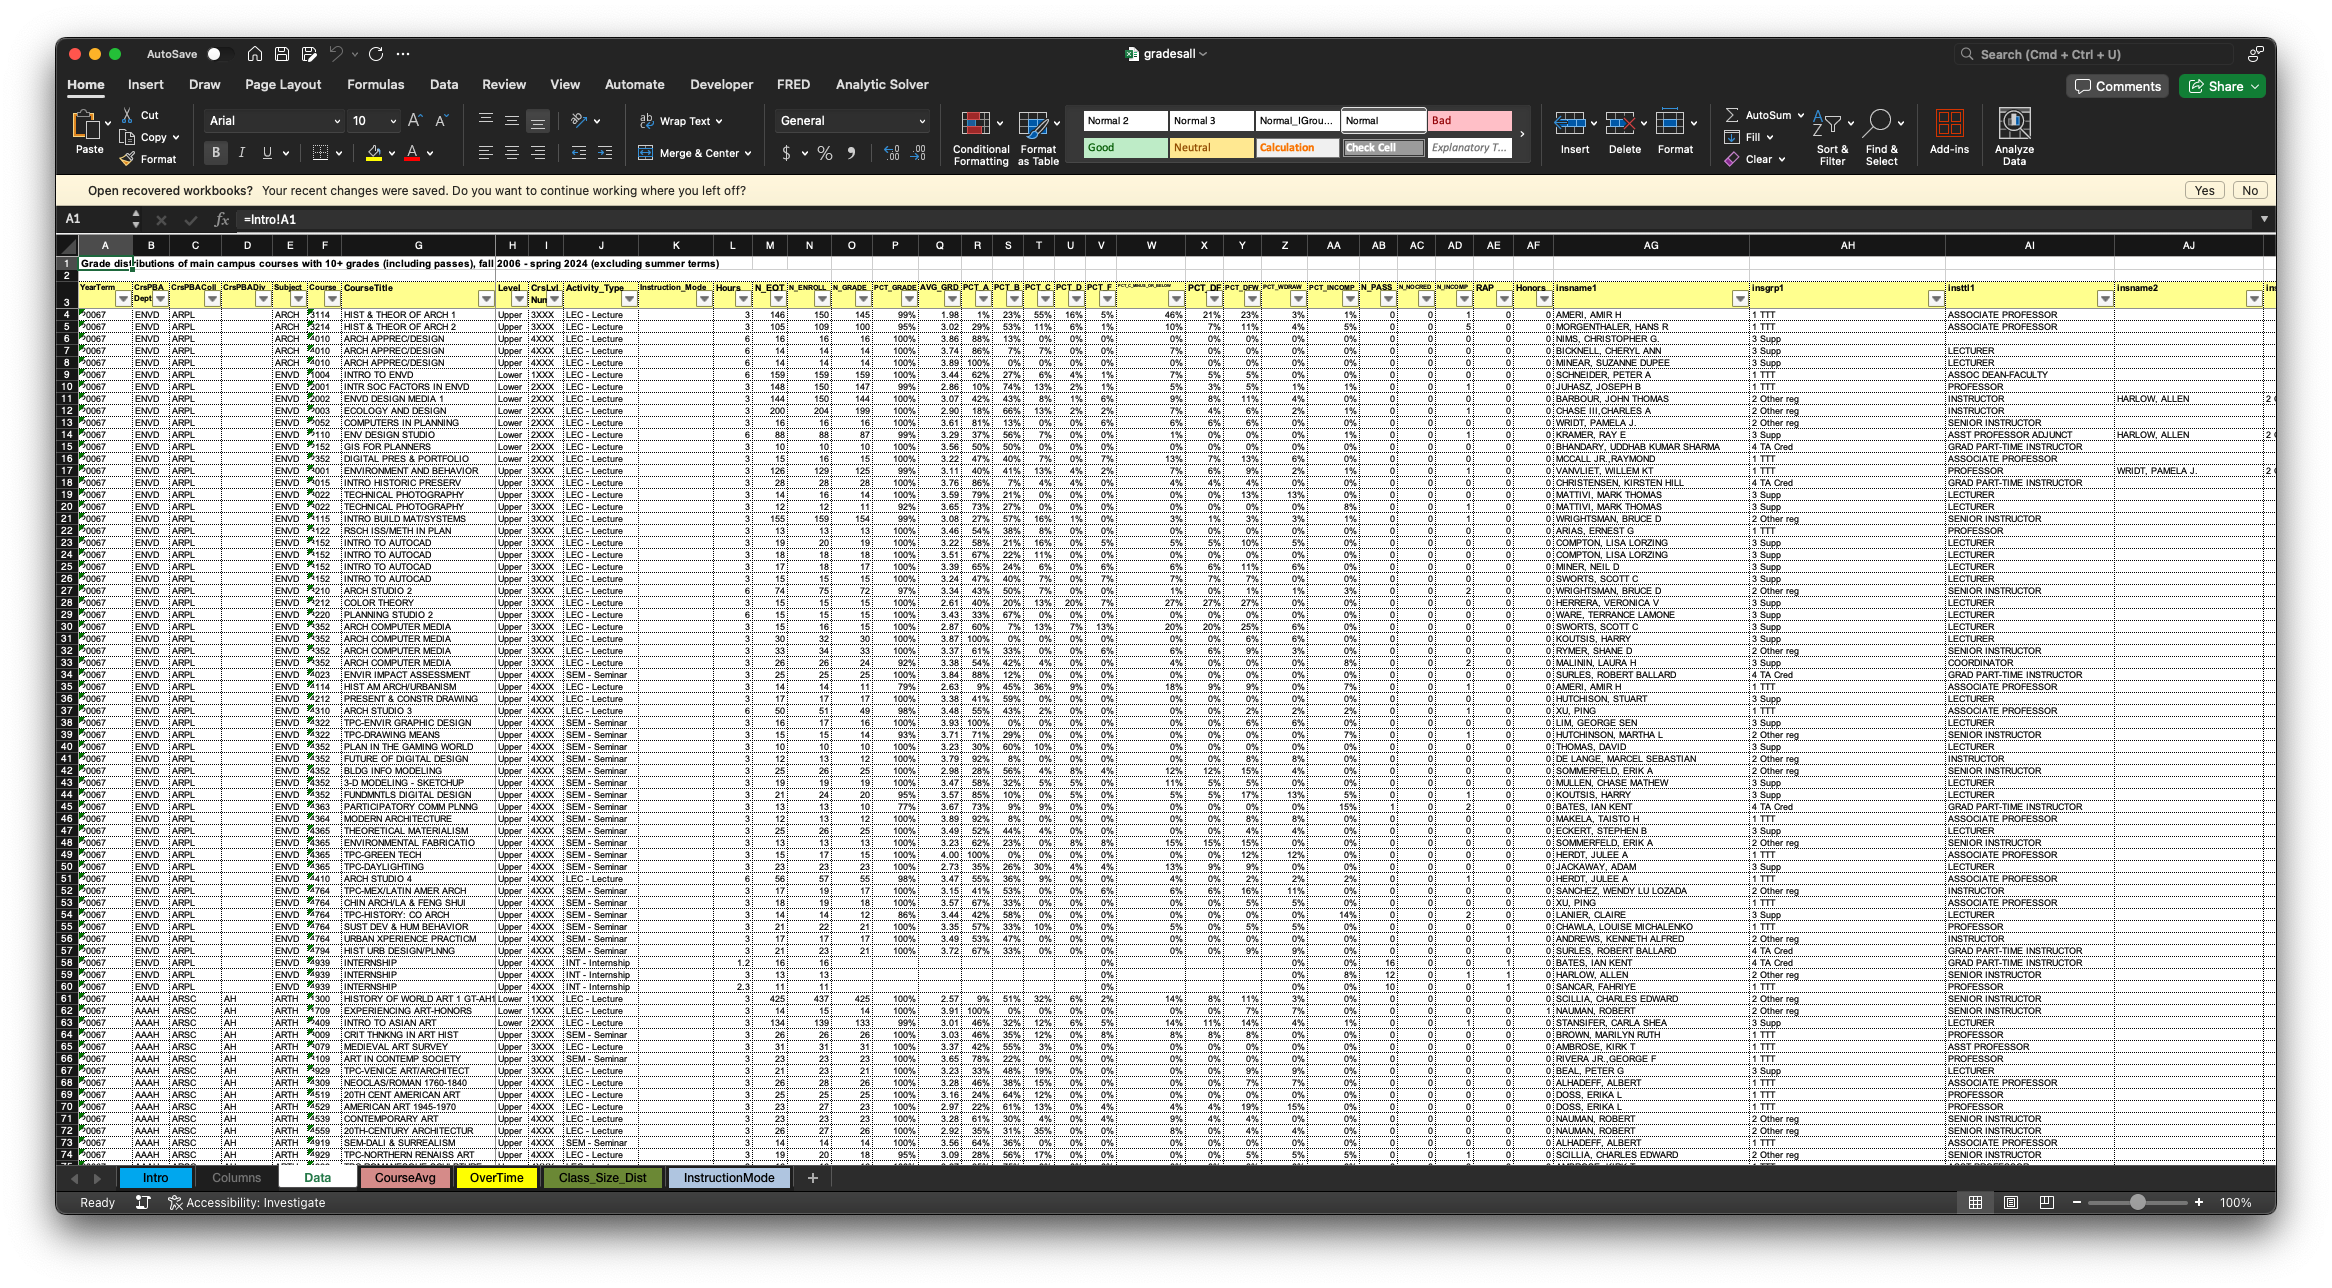
Excel is amazing. But, sometimes you just want a simple search tool where you don't have to manually use any formulae. Enter SQLite, the best thing since sliced bread. I exported the spreadsheet as a CSV and imported it into SQLite with a custom table schema.
CREATE TABLE IF NOT EXISTS "raw_data"
  (
     "yearterm"             INTEGER,
     "crspbadept"           TEXT,
     "crspbacoll"           TEXT,
     "crspbadiv"            TEXT,
     "subject"              TEXT,
     "course"               INTEGER,
     "coursetitle"          TEXT,
     "level"                TEXT,
     "crslvlnum"            TEXT,
     "activity_type"        TEXT,
     "instruction_mode"     TEXT,
     "hours"                REAL,
     "n_eot"                INTEGER,
     "n_enroll"             INTEGER,
     "n_grade"              REAL,
     "pct_grade"            TEXT,
     "avg_grd"              REAL,
     "pct_a"                TEXT,
     "pct_b"                TEXT,
     "pct_c"                TEXT,
     "pct_d"                TEXT,
     "pct_f"                TEXT,
     "pct_c_minus_or_below" TEXT,
     "pct_df"               TEXT,
     "pct_dfw"              TEXT,
     "pct_wdraw"            TEXT,
     "pct_incomp"           TEXT,
     "n_pass"               INTEGER,
     "n_nocred"             INTEGER,
     "n_incomp"             INTEGER,
     "rap"                  INTEGER,
     "honors"               INTEGER,
     "insname1"             TEXT,
     "insgrp1"              TEXT,
     "insttl1"              TEXT,
     "insname2"             TEXT,
     "insgrp2"              TEXT,
     "insttl2"              TEXT,
     "insname3"             TEXT,
     "insgrp3"              TEXT,
     "insttl3"              TEXT,
     "section"              TEXT,
     "ncomb"                INTEGER,
     "subject_label"        TEXT
  );
sqlite> .mode csv
sqlite> .import data.csv raw_data
Since I wanted the database to be small in size to be able to load it on shitty cellular connections, I said goodbye to pre-2006 data.
sqlite> DELETE from raw_data where YearTerm < 20161
sqlite> VACUUM;
Making Sense of the Data
I focussed on three things:
- Searching by Instructor - Given a professor is there a way to see the classes they have taught, and the average grades in those classes?
- Searching by Class Code - If there are multiple professors teaching a class, which professor should I go with?
- Searching by A&S Division that class fulfils - Can I find classes that fulfil certain requirements and are either upper or lower division?
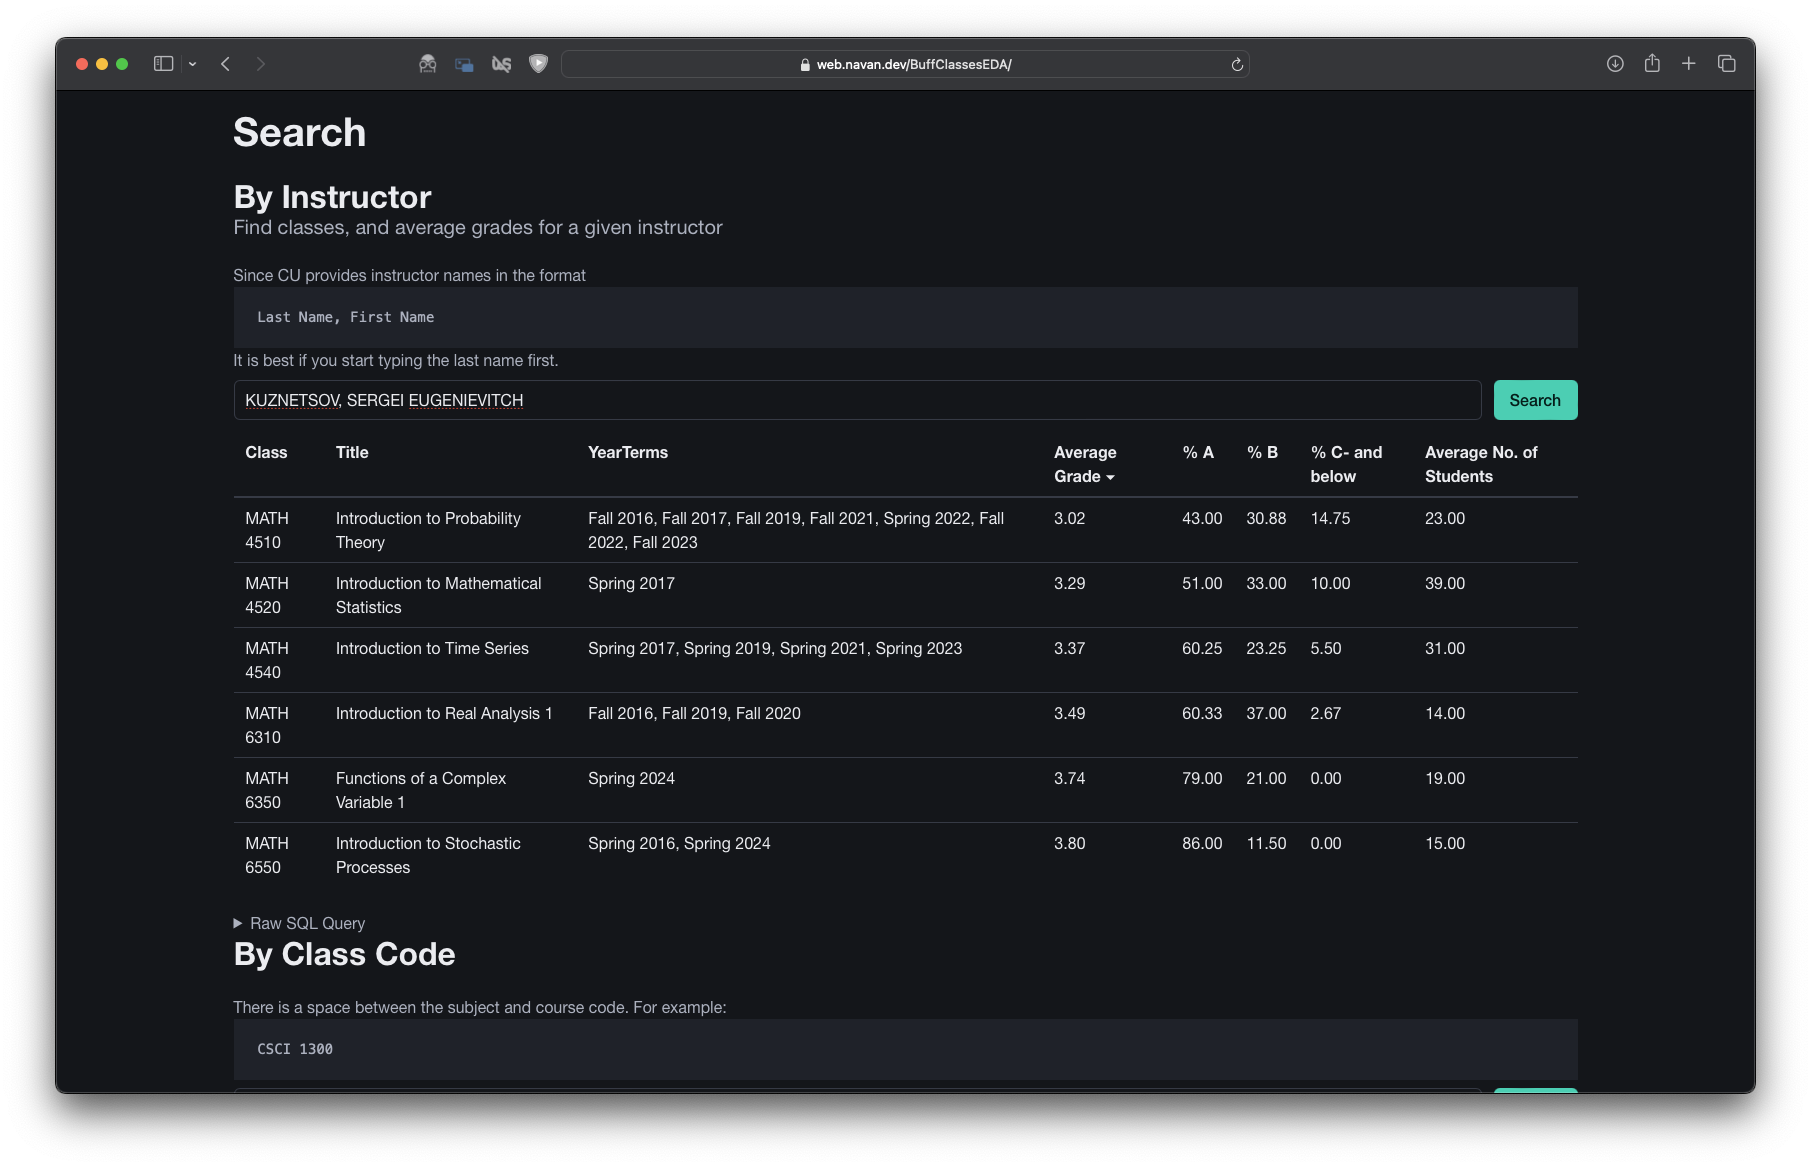
By Instructor
SELECT subject
       || ' '
       || course                           AS "Class",
       coursetitle                         AS "Title",
       Group_concat(DISTINCT yearterm)     AS YearTerms,
       Round(Avg(avg_grd), 2)              AS "Average Grade",
       Round(Avg(pct_a), 2)                AS "% A",
       Round(Avg(pct_b), 2)                AS "% B",
       Round(Avg(pct_c_minus_or_below), 2) AS "% C- and below",
       Round(Avg(n_grade))                 AS "Average No. of Students"
FROM   raw_data AS main
WHERE  insname1 = "$VARIABLE"
        OR insname2 = "$VARIABLE"
        OR insname3 = "$VARIABLE"
GROUP  BY coursetitle
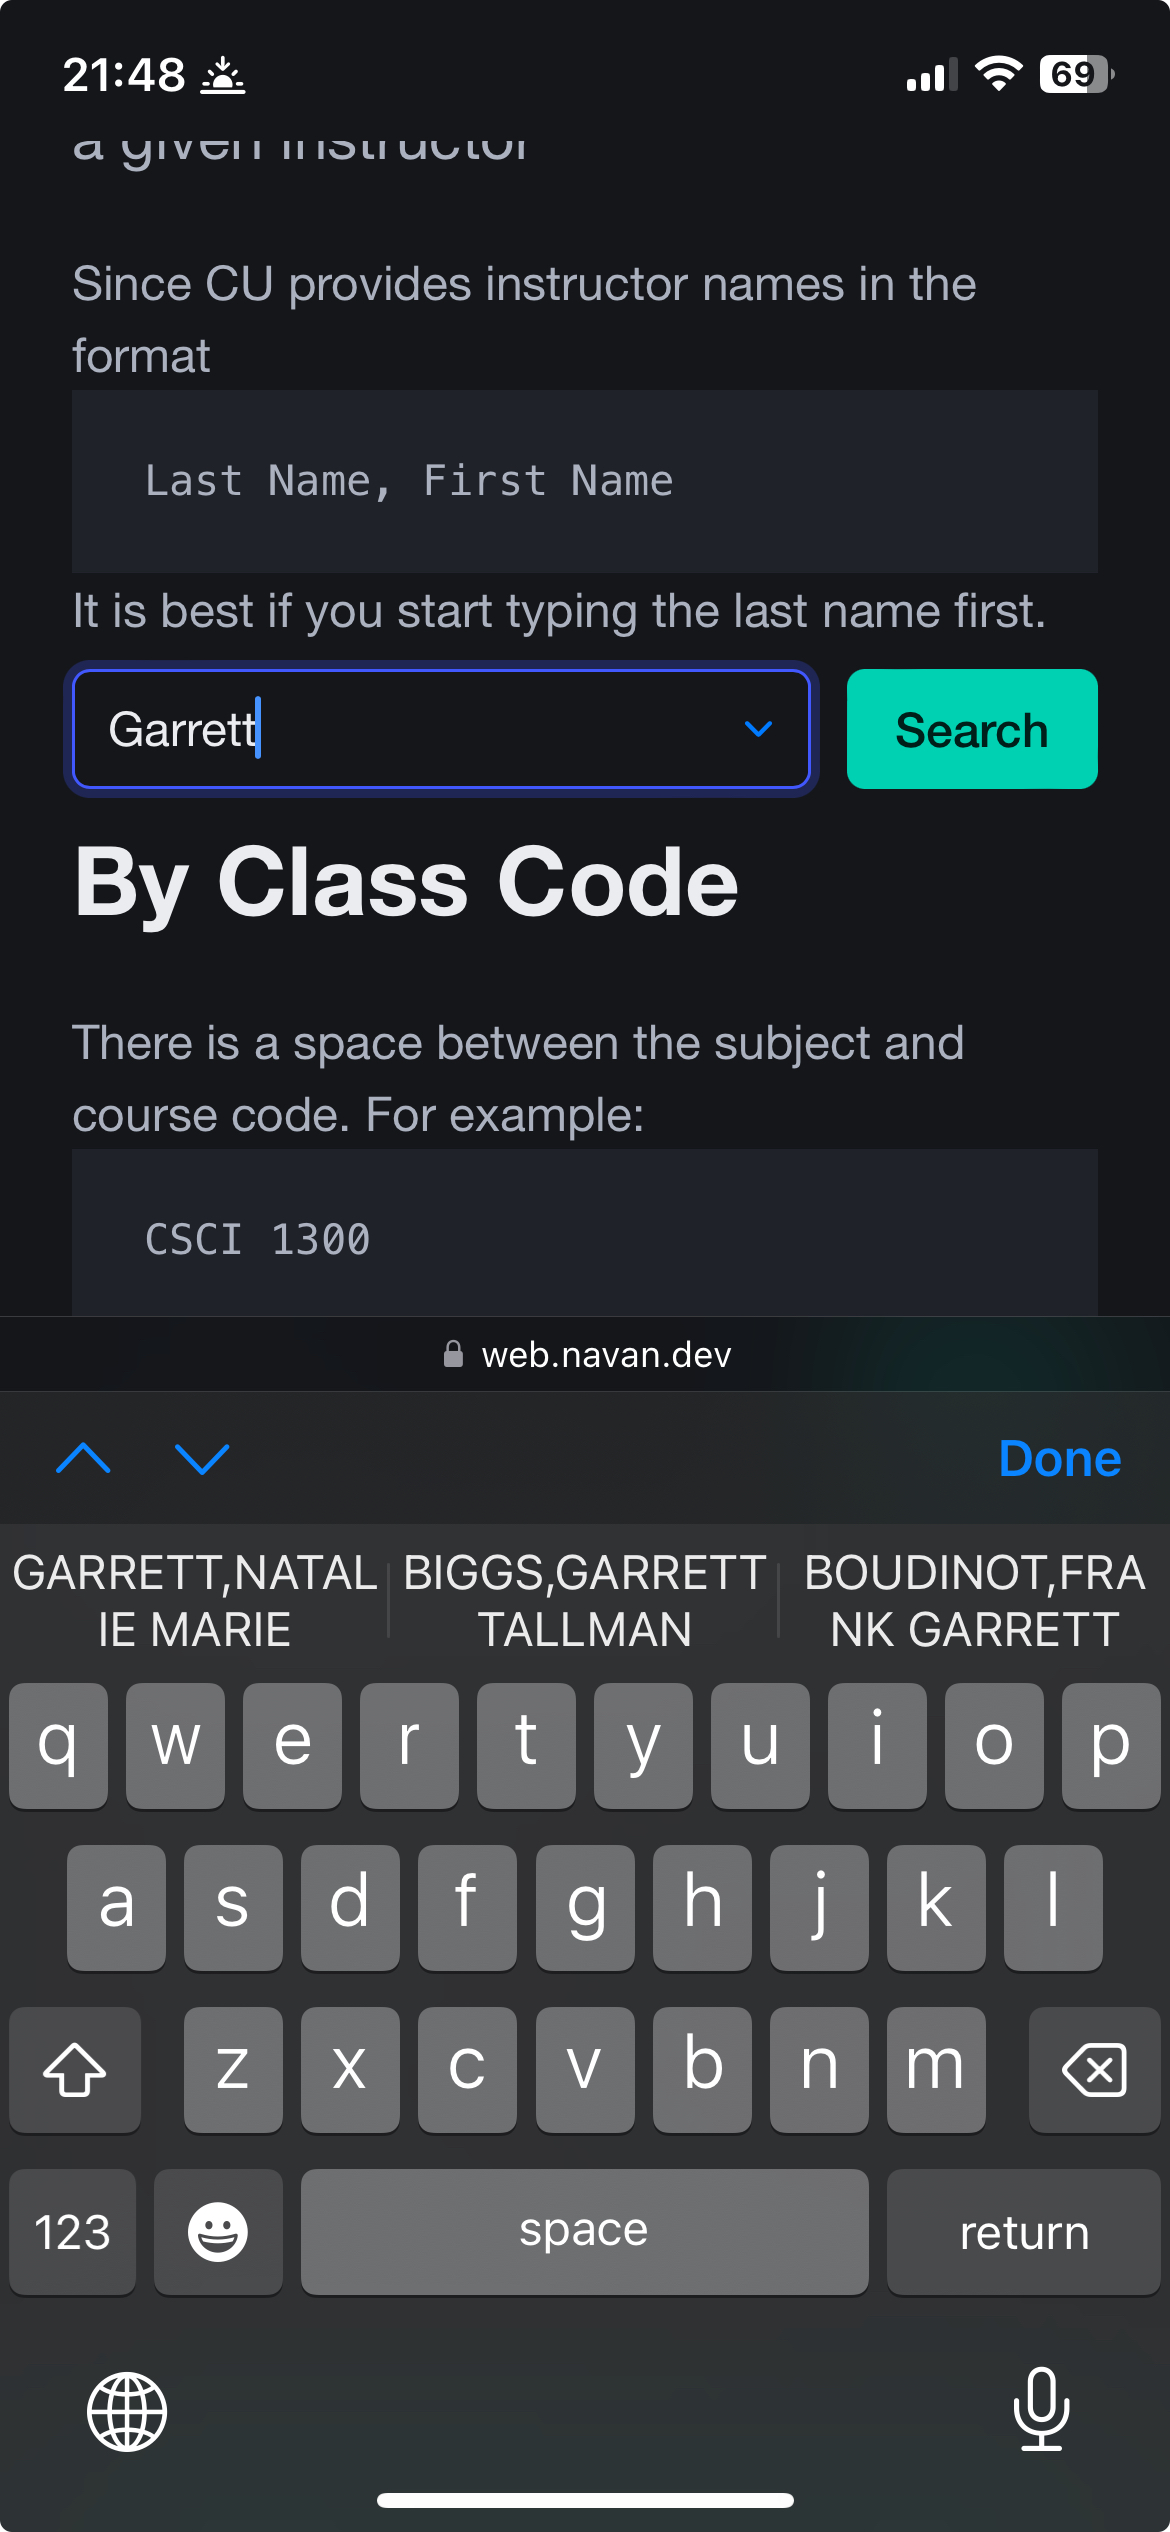
The database takes the instructor name in the format Last Name, First Name
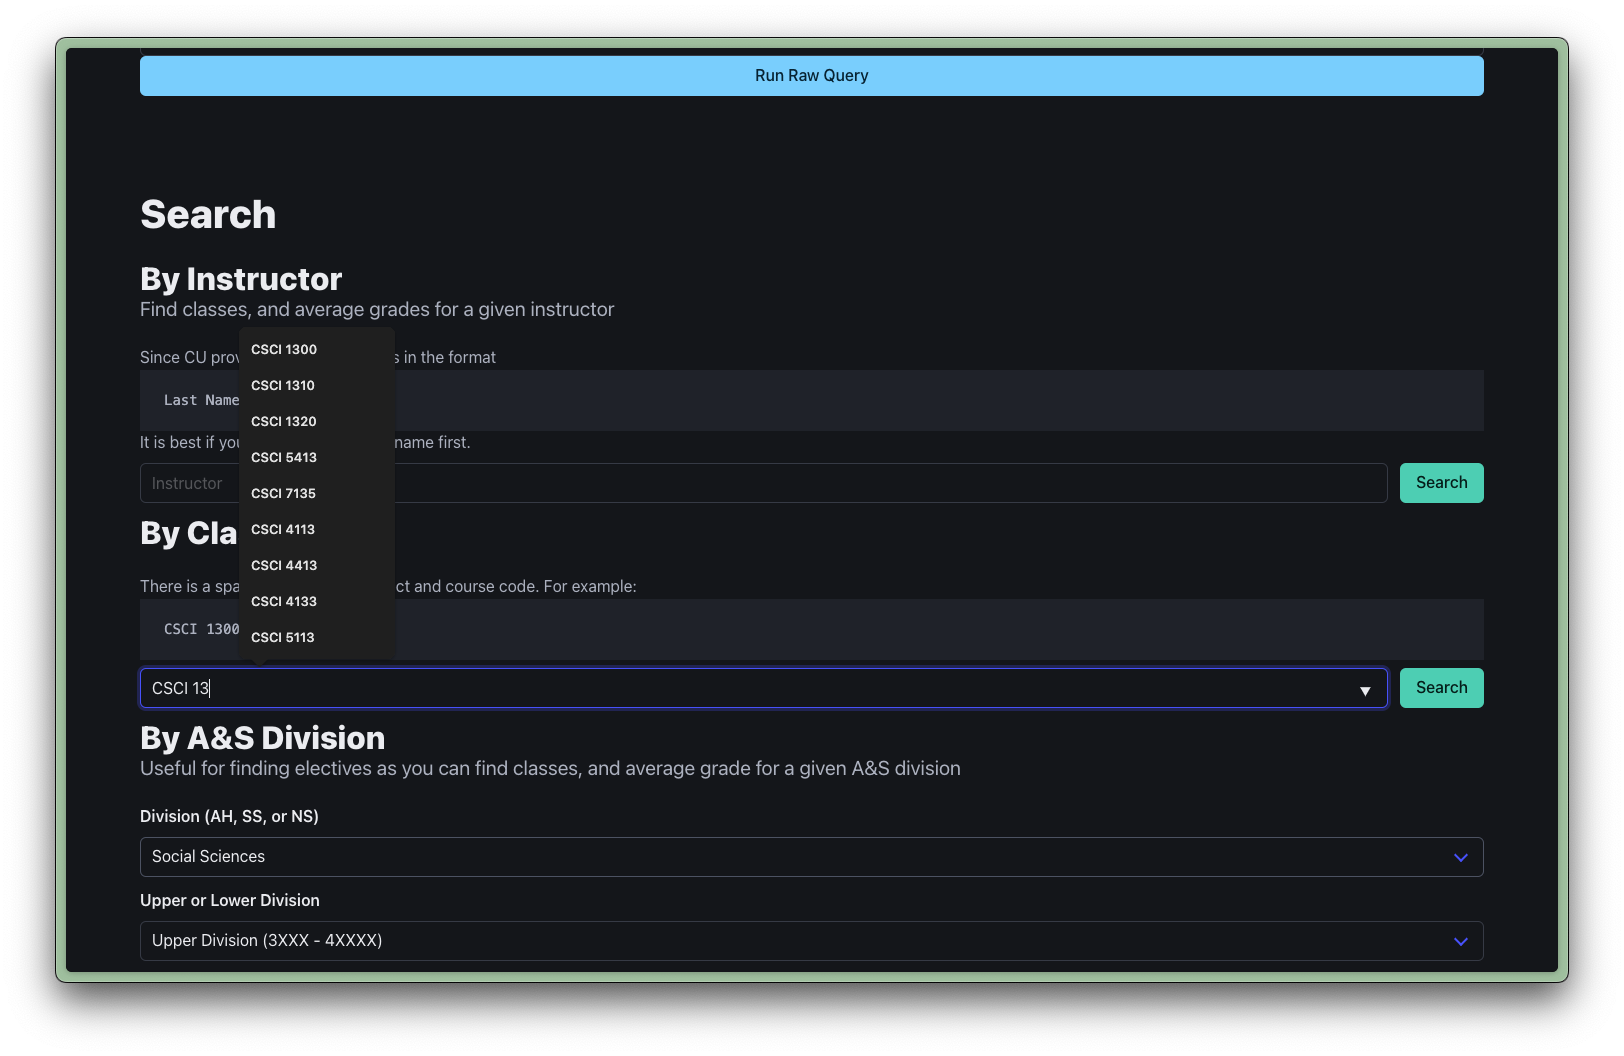
By Class Code
SELECT yearterm             AS "YearTerms",
       insname1             AS Instructor,
       avg_grd              AS "Average Grade",
       pct_a                AS "% A",
       pct_b                AS "% B",
       pct_c_minus_or_below AS "% C- and below",
       n_grade              AS "No. Graded"
FROM   raw_data
WHERE  subject
       || ' '
       || course = "$VARIABLE";
Where the variable is the class code we are search for.
By A&S Division
SELECT DISTINCT subject
                                || ' '
                                || course AS "Class Code",
                coursetitle               AS "Title",
                Avg(avg_grd)              AS "Average Grade",
                Avg(pct_a)                AS "% A",
                Avg(pct_b)                AS "% B",
                Avg(pct_c_minus_or_below) AS "% C- and below",
                Avg(n_grade)              AS "No. Graded"
FROM            raw_data
WHERE           (
                                crspbadiv = "$VARIABLE"
                AND             course "$VARIABLE" )
AND             subject != 'APPM'
GROUP BY        "Class Code",
                "Title"
Here the first variable represents the Arts & Science division:
* AH - Arts & Humanities
* SS - Social Sciences
* NS - Natural Sciences
The second variable is used to craft the class code range. If we only wanted to see upper division courses we would substitute it with BETWEEN 3000 AND 4000
Web-ifying the Data
Now now now, I could have obviously stopped here since I know how to craft SQL queries. But where is the fun in that?
I created a simple interface using Bulma. To run SQLite in the browser I used SQL.js
Loading the database
...
<script src="https://cdnjs.cloudflare.com/ajax/libs/sql.js/1.9.0/sql-wasm.js" onload="" integrity="sha512-PAyD/84QEfxE1X/H3RDJY9kqXtJObyGq6qA93+LnkMNWdTLHjcTKHsDOcz6Y5xAdsaMGItRP5vNs4vtj3/FRuw==" crossorigin="anonymous" referrerpolicy="no-referrer"></script>

<script>
let SQL = undefined
let db = undefined

async function fetchDatabase(url) {
    const response = await fetch(url);
    if (!response.ok) {
        throw new Error('Great Buffaloes! HTTP Error with status: ${response.status}');
    }

    const blob = await response.blob();
    const buffer = await blob.arrayBuffer();
    const uInt8Array = new Uint8Array(buffer);

    db = new SQL.Database(uInt8Array)

}

async function loadDatabase() {
    SQL = await initSqlJs({
        locateFile: file => <!--CODE_BLOCK_1961-->
        });
    fetchDatabase("./grades.sqlite")
}

loadDatabase();
</script>
...
This loads up the database.
Adding autocomplete
The <datalist> element is perfect for creating a lightweight autocomplete for <input> elements. For the pre-defined queries I populate the elements with all possible inputs.
<script>
async function fethDatabase(url) {
    ...
    // One example of populating the datalist with all possible class codes
    let classCodeQuery = "SELECT DISTINCT Subject || ' ' || Course AS ClassCode FROM raw_data"
    const classCodeResults = db.exec(classCodeQuery);

    const classCodeResult = classCodeResults[0];
    const classCodeColumns = classCodeResult.columns;
    const classCodeRows = classCodeResult.values;

    let classCodeDatalist = document.getElementById("classCodes");

    for (let i = 0; i < classCodeRows.length; i++) {
        let option = document.createElement("option");
        option.value = classCodeRows[i][0];
        classCodeDatalist.appendChild(option);
    }
}
</script>
...
Making the table sortable
I found this amazing library called sorttable.js to make the resulting table I was generating to be sortable. All I had to do was add the sorttable class to the table element and then call the library
...
const results = db.exec(query);
createTable(results, "table-container", query);
sorttable.makeSorable(document.getElementById("table-container").children[0]);
...
The full code is available on GitHub.
A Word of Caution: The Fine Print
If you came here to learn how to do this with another database or
The "Easy A" Mirage
Sure, that PHIL 1400 class might have an average grade that makes it look easy. But remember, just because something's labelled "easy" doesn't mean it is right for you. It's like picking classes based solely on their proximity to the campus coffee shop - tempting but not always wise.
Challenge by Choice
College is about growth, learning, and the occasional existential dread where you ask why you are doing something even though we are all going to die one day and nothing matters. Sometimes, the class with the lower average grade might be the one that actually helps you learn and grow.
Past Performance != Future Results
Just because a class was super easy during Covid with a particular professor does not mean it will be easy now that the professor is teaching that class again. Remember, there's more to a class than its GPA. Like, you know, actually learning stuff. Crazy concept, I know.
In Conclusion: The TL;DR
This is just a fun tool to inform your decisions, not to make them for you. Also, don't underestimate how stupid some people can be.